Bitcoin Price Prediction – May 20
After a successful break above $38,000, the Bitcoin price extends its recovery to touch the daily high at $42,605.
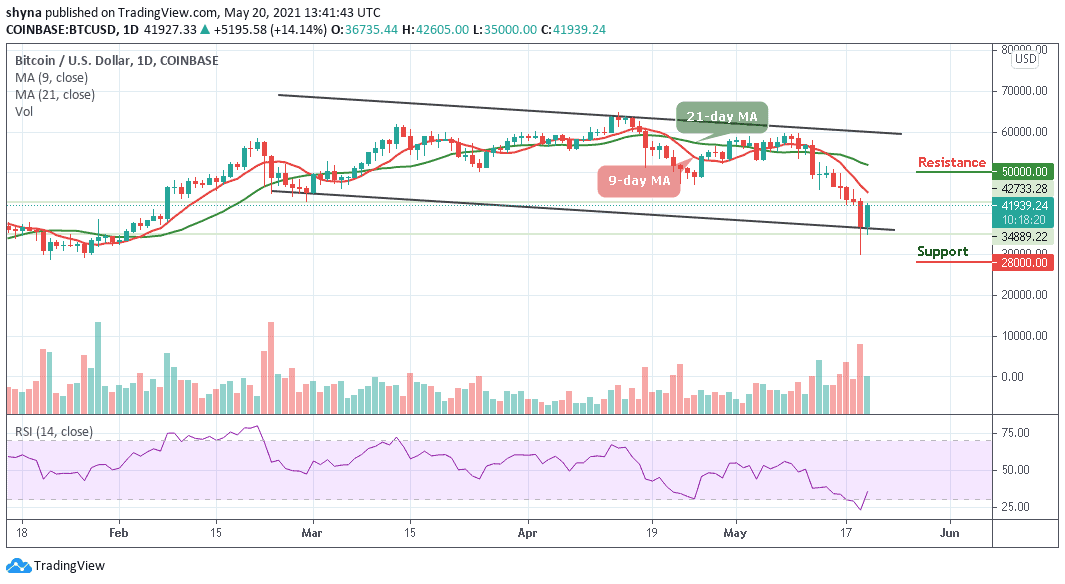
BTC/USD Long-term Trend: Bearish (Daily Chart)
Key levels:
Resistance Levels: $50,000, $52,000, $54,000
Support Levels: $28,000, $26,000, $24,000
For the past few weeks, BTC/USD has seen some sharp declines in the crypto market as the price slumped to $30,000 support. The Bitcoin price also settled below the 9-day and 21-day moving averages and the movement is very fragile at the moment. However, during a short-term breakout, critical support levels must be monitored as the first digital asset stays around the lower boundary of the channel.
Bitcoin Price Prediction: Is Bitcoin Bull Run Still Intact?
Looking at the daily chart, the Bitcoin price has increased more than 14% over the past 24 hours to touch the daily high of $42,605. More so, the first digital cryptocurrency was linked to the early hours of Asia, thus consolidating the gains of the previous session. Therefore, a sustained movement of more than $5,000 has improved the technical situation in the long term; however, the critical support of $30,000 could not be interrupted at this time.
0On the upside, if there is an upside break above $43,000 and $45,000, the Bitcoin price could recover towards the $46,000 and $48,000 levels. However, if the price increases and manages to close well above the 9-day MA, traders could see an upward price explosion, which could reach the potential resistance at $50,000, $52,000, and $54,000 levels as the Relative Strength Index is moving out of the oversold zone.
Conversely, there could be more losses if there is no break above the $42,000 level. The main supports on the downside are located at $40,000 and $35,000. Therefore, if there is a downside break below the lower boundary of the channel, the Bitcoin price may accelerate decline towards the support levels of $28,000, $26,000, and $24,000 respectively.
BTC/USD Medium – Term Trend: Bearish (4H Chart)
Looking at the 4-hour chart, BTC/USD should recover above $41,000 to mitigate the short-term bearish pressure and allow for an extended recovery towards $45,000 and above. However, a sustainable move below this level may open up the way towards $38,000.
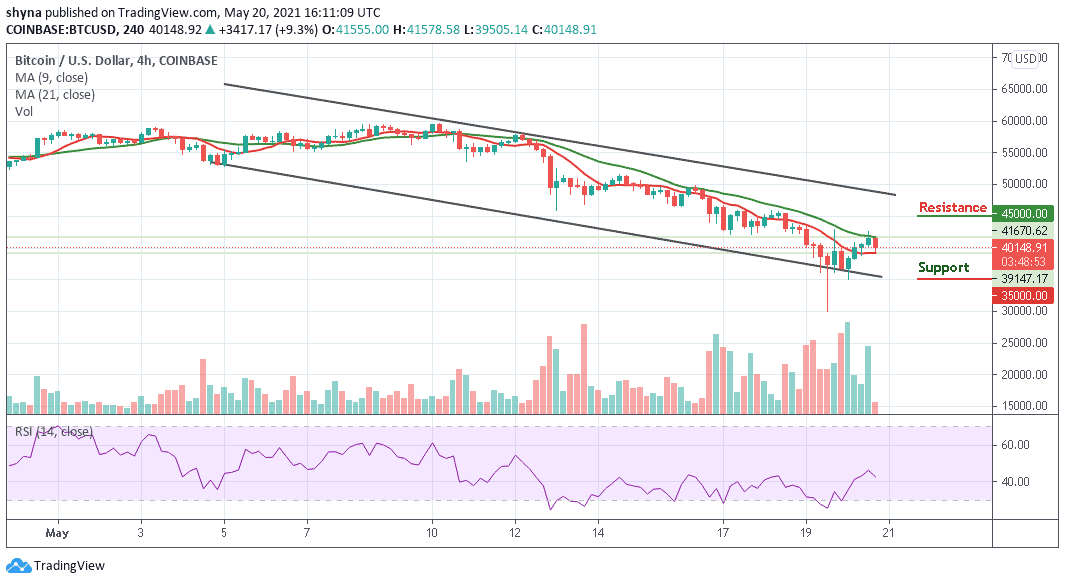
In addition, the critical support is located at $38,000, and a sustainable move lower could increase the downside pressure and push the price towards the support of $35,000 and below. Considering that the Relative Strength Index (14) signal line is reverting to the downside again, we might expect that more bearish signals to play out.
The post BTC/USD Revives Back Above $40,000 appeared first on Crypto new media.